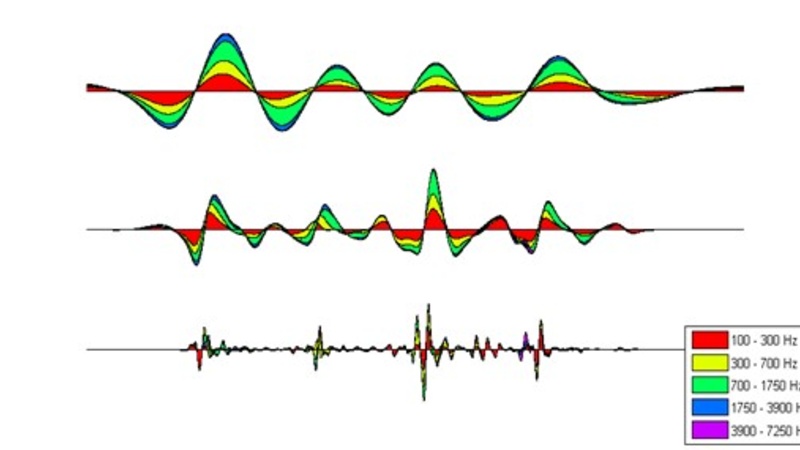
Plot S-AMPH matrix tA
The following MATLAB code should plot the 3 x 5 SAMPH matrix of the example soundfile “Mary Mary quite contrary”, in the format as shown below.
pad = zeros(size(tA,1),1);
figure
for m = 1:3 subplot(3,1,m);
data = [squeeze(tA(:,m,:)),pad];
area(data), colormap hsv
axis tight, axis off
end
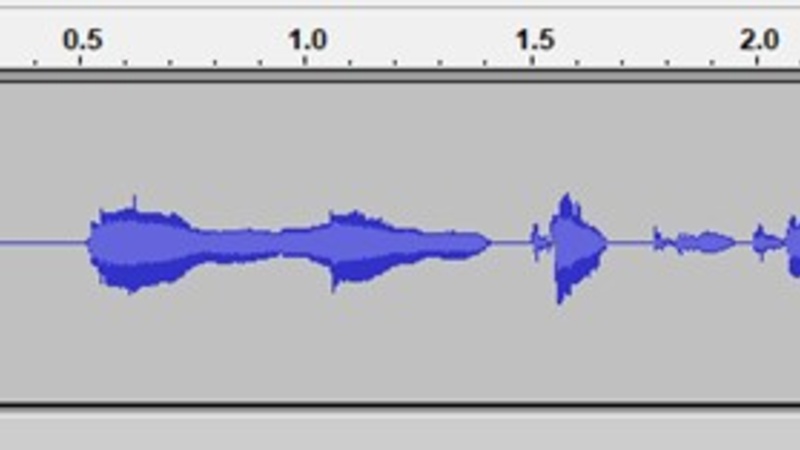
Waveform of “Mary Mary quite Contrary”