
Introduction to SAMPH
Spectral- Amplitude Modulation Phase Hierarchy (S-AMPH) is a low-dimensional representation of speech dynamics (Leong, 2012). In the S-AMPH analysis, broadband speech is filtered into five narrow bands spanning 100 – 7250 Hz. Dominant amplitude modulations (AMs) corresponding to the phonological levels of prosodic stress, syllable rate, and onset-rime units are extracted by filtering of the five bands, resulting in a 5 frequency band by 3 modulation rate model as shown in the figure below.
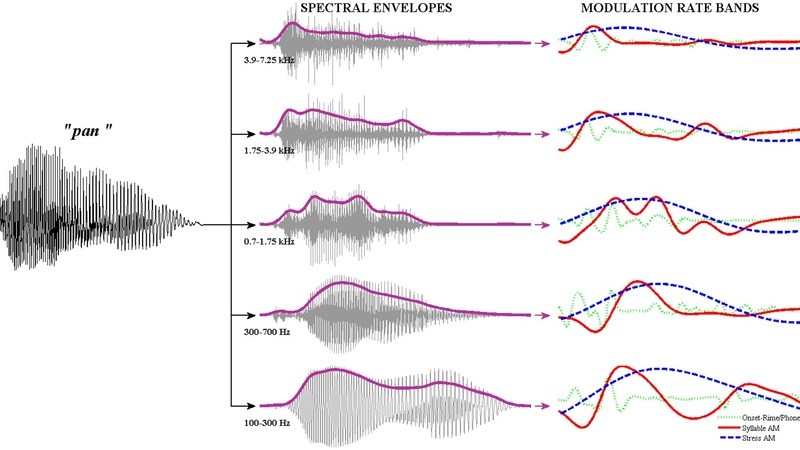
Example of the 5x3 spectro-temporal representation of speech modulation structure.
(Left column) Original acoustic waveform for the word "pan". (Middle column) 5-spectral band filtered signal with Hilbert envelopes from each spectral band overlaid in bold. (Right column) Final 5x3 spectro-temporal representation. 3 modulation rate bands (Stress, Syllable & Phoneme) are extracted from each of the envelopes in the 5 spectral bands. Each modulation rate band is plotted in a different colour.
From Leong and Goswami (2015). https://doi.org/10.1371/journal.pone.0144411.g009
To implement/develop the model for your own application, some knowledge of MATLAB is assumed. The MATLAB code and further instructions are provided. There is a guide to plot the results, and analyse the output. The following pages will start with an overview followed by a worked example.