
The Modulation Spectrum
However, there is more modulation information in the signal than revealed by the broadband envelope. Temporal envelopes from broad frequency bands of the speech signal are known to carry the speech information (Shannon et al., 1995).
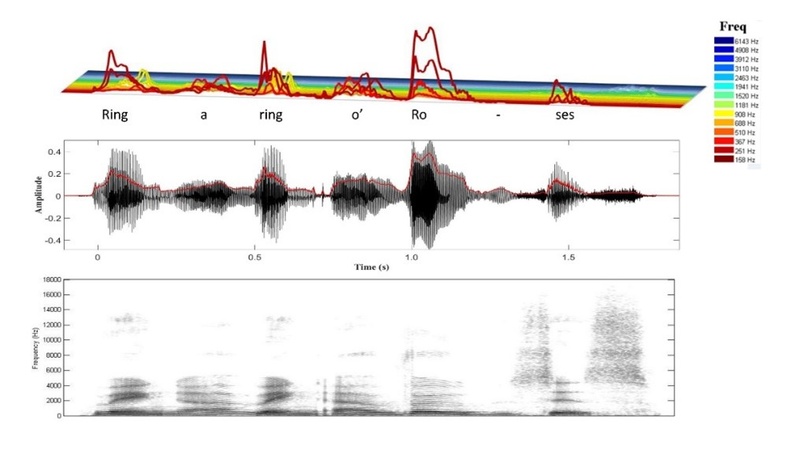
In the figure below, the speech is filtered into separate bands. The frequencies peak and drop at different times, with a difference in modulation across the frequencies from 200 – 7000 Hz.
By separating the speech into narrow bands then subsequently bandpass filtering (24 logarithmically spaced filters in the range 0.9 to 40 Hz), the modulation energy in each spectral band is found. Plotting the output of the 24 modulation filters, reveals the Modulation Spectrum. An example is shown below.
The MATLAB file to extract and plot the modulation Spectrum can be found HERE.